


UK: Voting intention and methodology update – 11th February 2022
Labour holds a 3 point lead under our new methodology. However, the smaller lead is because of the new methodology, not because of a weakening in Labour’s position.
Summary
- The new methodology makes sure we are getting a sample that is balanced on political attention, ethnicity, as well as education qualifications
- We are using a new approach to turnout weighting to ensure our voters are representative of those people who actually vote in General Elections
- One big effect of this is to decrease the importance of the fact that many Conservative voters are moving to undecided (and being excluded from the headline vote share figure), which is a big part of the reason for the recent Labour leads
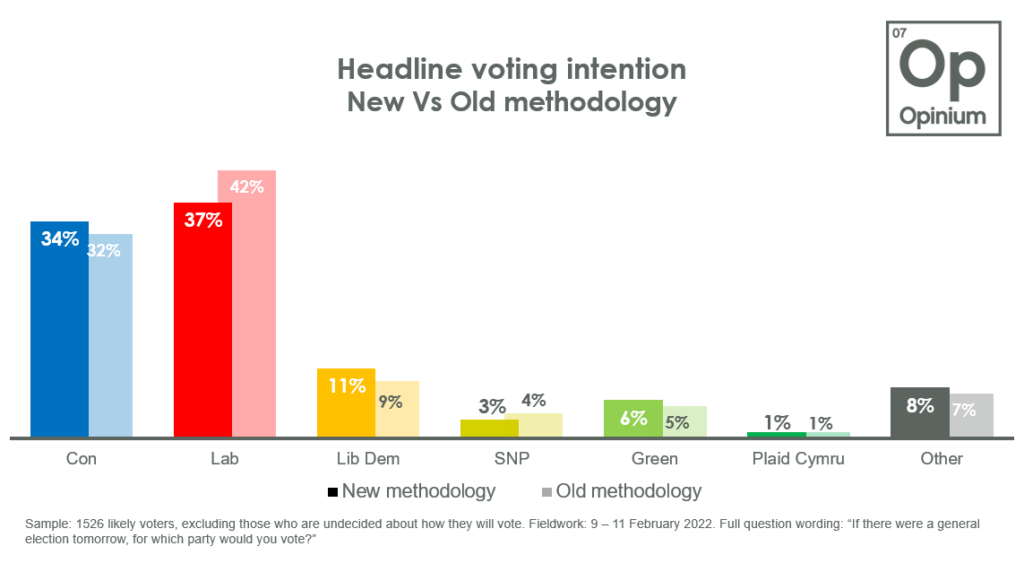
- Our latest voting intention figures show Labour on 37%, the Conservatives on 34%, the Lib Dems on 11%, and the Greens on 6%.
- The rough headline figures under our old methodology would have been Lab 42% (+3), Con 32% (-2), so we haven’t actually seen a decrease in support for Labour over the past fortnight – it is the shift in methodology that has caused the difference.
At Opinium we have always been proud of the way we have accurately and built representative samples of the British public, truly reflecting what they think, feel, and do.
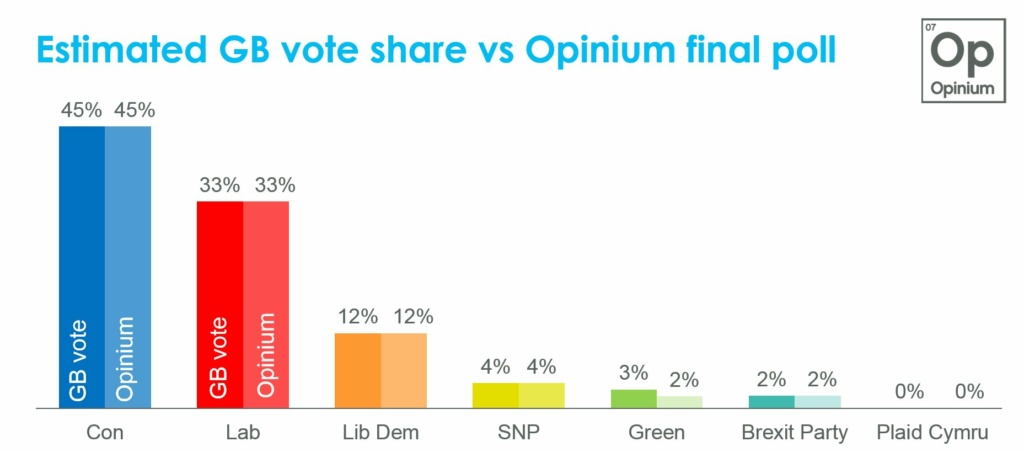
Our dedication to high-quality research can be seen through the way our polling has accurately matched the results of recent election results. In the 2019 General Election, our final poll matched the final result almost exactly – with only the green vote overstated by 1%.
Similarly, while most of the industry showed Remain ahead during the referendum campaign, our final poll predicted a narrow Leave victory.
Part of the way we have continued to provide accurate polling is by continuing to monitor and update our methodologies even when we have been accurate, to ensure our polling is still reflective of Britain how it is today. As part of that process, the Opinium political team has spent the past few months testing out new approaches to its political polling.
That review has now been completed and we are making some big changes to the way we run our political polls. Below are the four big changes and an explanation of why we have decided to make them.
- We will make sure our polls have enough people in who aren’t paying attention to politics
People who take part in online surveys are much more likely to say they pay attention to politics, something we have found to be fairly consistent across all online panels we have tested.
We know this because we can compare the responses people give to a question about political attention in an online survey, with the answer people give in the British Election Study face to face survey (table below).
| British Election Study face to face (2015/2017) | Online panels (average) | |
| Low (0-2) | 19% | 11% |
| Mid (3-7) | 60% | 39% |
| (High (8-10) | 20% | 40% |
We also know that political attention makes a big difference in the way voters behave. As an example, low-political-attention 2010 Lib Dem voters were more likely to move to the Conservatives in 2015 while high- political–attention ones were more likely to move to Labour.
As well as voting intention, it also makes a big difference for other polling questions. For example, current Labour voters who don’t pay much attention to politics are less likely to think Keir Starmer is doing a good job than ones who are paying a lot of attention to politics.
Going forward, we will be actively sampling to increase the proportions of those who classify as low or mid political attention and weighting our political sample to be representative based on political attention, using targets from the British Election Study.
2. We will make sure our samples are balanced based on ethnicity
We have done lots of work at Opinium to make sure we are also reflecting the views of ethnic minorities. This includes our flagship “Multicultural Britain” survey and our recent work on the Black Pound report for BACKLIGHT.
However, as the size of Britain’s ethnic minority population grows, we also think it is important to ensure our nationally representative samples are also balanced by ethnicity.
We will therefore weight our political surveys to make sure that the proportions who are white, mixed race, Indian, Pakistani and Bangladeshi, Black, and other ethnicities matches that of Modern Britain.
While the proportions will match the general population, we will not be adding a cross break of ethnic minorities onto our tables as we still think that a nationally representative read of ethnic minorities in the UK would require a separate survey sampled and weighted to be representative of the demographics of the ethnic minority population.
However, during general elections, Opinium will conduct nationally representative voting intention surveys among ethnic minorities specifically so we can get
3. We will ensure we don’t have too many older graduates
When deciding what variables to weight survey data by, it is also important to consider how weighting variables interact with each other. More specifically, while we can have the right number of graduates vs. non-graduates, and the right proportions of older vs. younger people overall, our review has shown that we do not have enough older people with no (or very few) qualifications in our sample.
This hasn’t been too much of a problem in the last two general elections, because older people were supporting the Conservative’s regardless of their education levels. However, with Labour now starting to gain back some more older voters, it appears like they are doing much better among older people with more qualifications than those without.
We will therefore introduce a new weighting variable that is age crossed with gender crossed with education qualifications. Up to date data on this is not readily available, because (for reasons that make no sense) the annual population survey / British labour force survey does not feel the need to ask retired people what qualifications they have.
We have therefore developed estimates based on the 2011 census data and, when more accurate data becomes available from the 2021 census, we will update our targets with that new information.
4. We will pioneer a new approach to turnout weighting
Finally, and probably most importantly, we will completely change the way we approach turnout in our samples. One of the reasons why voting intention is so difficult to measure is because we aren’t just trying to work out who people will vote for, but whether they will vote at all.
The traditional approaches to dealing with this issue in opinion polls have fallen into two camps. Firstly, don’t do anything. Secondly, to try and take a representative sample of the population and then turn that into a sample of voters by excluding those who are undecided or say they are unlikely to vote.
However, neither of those approaches is particularly effective because too many people in opinion polls say they will vote. This is firstly because many people overstate how likely they are to vote, but also because those who are likely to vote are more likely to take part in opinion polls.
Furthermore, this isn’t equal across all demographic groups. Younger people who take part in opinion polls are much more likely to overclaim how likely they are to vote than older people.
Instead, we are going to weight our voting intention question differently. Firstly, we will only take those respondents who give a voting intention (e.g. removing those who are undecided or say they won’t vote). Secondly, we will use the same weighting variables as we have for the population weights, but change the targets so we are representative of those who have voted in recent general elections.
This is similar to the approach taken by MRP models that have accurately forecasted the results of the last two elections.
These targets will be developed by looking at past turnout data from the 2015 and 2017 British Election Studies and, again, will be updated once the equivalent from 2019 is available.
Of course, this does mean that we are limited in our ability to pick up on dramatic changes in turnout patterns. However, given how inaccurate people are at claiming their likelihood to vote in elections, we believe that past data is a much more reliable guide of who will vote in an election than self-reported data from a survey. Furthermore, British Election Study data has frequently shown that turnout patterns don’t often change that much between elections.
As a safety mechanism, we will still collect and monitor data on how likely people are to say they will vote in an election, to see if this changes dramatically from what we have seen historically.
The impact on undecided voters
we approach a general election campaign. At the moment, if a voter says they are undecided they are removed from the headline figures and treated as if they wouldn’t vote in an election.
We are currently seeing a lot more 2019 Conservative voters moving to undecided and this is having a large impact on those who “count” towards voting intention. If only the people currently being included in headline voting intention questions had voted at the last election, then the Conservatives would have won by only 6 points, rather than 11.
Our new methodology fixes that, because it weights up the 2019 Conservative voters who do give a voting intention to account for the fact that others are undecided. This is the main reason our Labour lead is smaller than it otherwise would have been.
We believe this is the more accurate way of reflecting voting intention midterm, although no method is perfect. The main reason for this is because, when we squeeze the voting intentions of those 2019 Conservative voters who are undecided, the majority say they would still vote Conservative if they were forced.
However, it will mean a shift is required in the way our polls are analysed. For the past few months people have generally considered the high number of Conservative don’t knows to be a caveat against the high Labour poll leads. In our case, the opposite is now true. The existence of the high number of 2019 Conservative undecided voters is more likely to increase the Labour lead at a later date rather than decrease it. Our tables will still release all this information so people can see for themselves the number of undecided voters and where they are coming from.
Going forward…
For the next three waves of the poll we will release the headline figures with our new methodology, but also what the figures would have been under our old methodology so we can understand change.
This will not quite be a perfect comparison because we have also changed the sample makeup of our polls (to include more ethnic minorities / low political attention people etc.) and the effects of this can’t be accounted for.
In this wave the voting intention figures under the old methodology would have been Lab 42% (+3), Con 32% (-2), Lib Dem 9% (NC), SNP 5% (-1), Green 5% (NC),
We will continue to monitor our methodology in the run-up to the next election and make updates if we think they are required. But ultimately this change is based on a better understanding of the strengths and weaknesses of online polling than we have previously had, and we believe it is both a better answer to the “if there was an election tomorrow” question, and will produce more accurate result when tested in a general election.
The tables for the latest results can be found here.