Political Polling – 18th September
18th September 2012
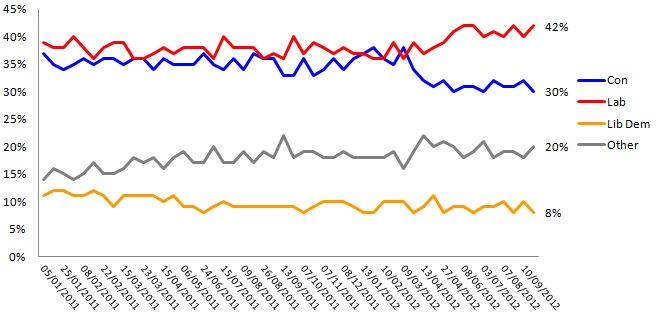
Going into the conference season, Labour have a comfortable 42% share of the vote compared to 30% for the Conservatives and 8% for the Liberal Democrats. The Lib Dems have again fallen behind UKIP in the battle for third place with the anti-EU party picking up 10% of the vote.
- David Cameron’s net approval rating is -20% with 32% approving while 52% disapprove compared to -14% for Ed Miliband of whom 25% approve while 39% disapprove
- 13% of likely voters approve of Lib Dem leader Nick Clegg while 61% disapprove giving him a net rating of -48%
This week we ran some extra questions for the Observer to coincide with the Liberal Democrat party conference, in particular among people who voted Lib Dem in 2010 but would not do so now.
- While Both David Cameron and Ed Miliband have net positive approval ratings among people who voted for their parties in 2010 (+44% for Cameron and +34% for Miliband), Nick Clegg has a negative rating among 2010 Lib Dem voters. While current Lib Dem voters approve of him by 54% to 16%, 2010 Lib Dem voters skew heavily against with 62% disapproving compared to just 19% who approve
- Since 2010 the Liberal Democrats have lost over half of their support with just 33% of people who voted Lib Dem in 2010 saying they would vote that way now while 39% would vote Labour. In contrast, 94% of 2010 Labour voters would vote Labour now and 81% of 2010 Conservative voters would vote Conservative if the election were held tomorrow
We asked respondents three questions about whether they were likely or unlikely to consider voting Lib Dem at the next election (expected in 2015). The first assumes that Nick Clegg is still leader, the second assumes that he has been replaced but does not say by whom while the third assumes that he has been replaced by Vince Cable.
- Among likely voters, just 12% would be likely to vote for the Liberal Democrats under Nick Clegg while 72% would not. 12% would be likely to vote Lib Dem under an unnamed new leader but the number who are unlikely drops to 60%. If Nick Clegg were replaced by Vince Cable, 13% of likely voters would be likely to consider voting for the Lib Dems while 59% would be unlikely, giving us 13% of likely voters who would be “less unlikely” to vote Lib Dem under Vince Cable than under Nick Clegg
- This suggests that while an alternative leader might not lead to an automatic jump in support for what we can no longer automatically refer to as the “third party”, it would make supporting the Liberal Democrats an option for a number of people who would not even consider doing so under Nick Clegg
- What is most interesting is if we look at respondents who say they voted Lib Dem in 2010 but have since defected to Labour. Among these respondents (110 likely voters), 87% would be unlikely to vote Lib Dem under Nick Clegg while only 8% would be likely giving us a net figure of -79% under the current leader. Under Vince Cable these figures change to just 49% unlikely and 24% who are likely with a net figure of -25%
- So again, Nick Clegg appears to be a significant barrier to the Liberal Democrats regaining some of the support they have lost to Labour since 2010 while switching to Vince Cable would lower this barrier albeit only by a fraction
Topline Voting Intention
| † | % | Change |
| Conservative | 30 | -2 |
| Labour | 42 | +2 |
| Liberal Democrats | 8 | -2 |
| Other parties | 20 | +2 |
Other Parties (breakdown)
| † | % | Change |
| UKIP | 10 | +1 |
| Green | 4 | +1 |
| SNP | 3 | n/c |
| BNP | 2 | n/c |
| Plaid Cymru | 0 | -1 |
| Other | 1 | n/c |
Approval ratings
| † | % Approve | % Disapprove | Net rating | Net rating (own party) |
| David Cameron | 32% | 52% | -20% | +76% |
| Ed Miliband | 25% | 39% | -14% | +40% |
| Nick Clegg | 13% | 61% | -48% | +38% |

Opinium Research carried out an online survey of 1,964 GB adults aged 18+ from 18th to 21st September 2012. Results have been weighted to nationally representative criteria.
Interview Method and Sample
This survey is conducted online by CAWI (computer aided web interviewing), using Opinium?s online research panel of circa 30,000 individuals. This research is run from a representative sample of GB adults (aged 18+ in England, Scotland and Wales). The sample is scientifically defined from pre-collected registration data containing gender, age (18-34, 35-54, and 55+), region (North East, North West, Yorkshire and Humberside, East Midlands, West Midlands, East of England, London, South East, South West, Wales, and Scotland), working status and social grade to match the latest published ONS figures.
Opinium also takes into account differential response rates from the different demographic groups, to ensure the sample is representative.


