
How we voted in 2017
The 2017 general election was one of the most extraordinary in post-war politics.†In trying to understand what happened on the 8th†June, we ran an on-the-day poll that allowed us to examine†how the country voted and where we saw the large movements in votes†that surprised us all so much last week.
Age
In 2015, most†age groups voted roughly evenly between Labour and the Conservatives. The only exception were the over 65s, who voted decisively for the Conservatives which tipped the balance in favour of David Cameron.†
However, in this general election, age appeared to become a key indicator of voting intention right from the young to the old.†The Conservatives have a huge lead of almost forty-points amongst over 65s, but Labour now also has relatively clear lead amongst†under 45s.†
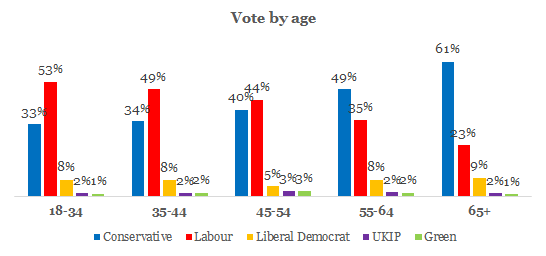
In fact, you can now draw a line between over and under 45s, with the two†showing an almost exact mirror image of preference for the two major parties. †
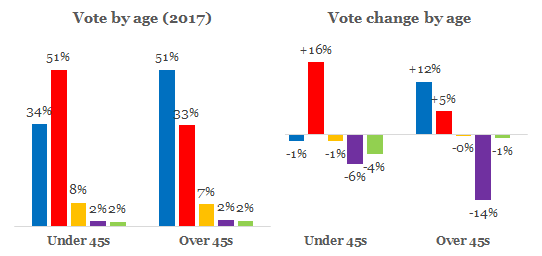
Here is the basic story of how the election went. Yes the Tories won by securing a lead amongst the larger number of older voters. However, the churn in votes shows how Theresa May lost her overall majority: there was a 9% swing in favour of Labour amongst under 45s, noticeably higher than the swing of 3% to the Conservatives amongst over 45s.
Gender
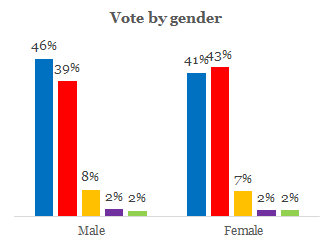
Last time there was relatively little difference between the way men and women voted. However, in this election†the Conservatives†retained their lead amongst men while losing†ground amongst female voters (Labour now has a 2-point led amongst women).
The particular problem the Conservatives faced amongst female voters†is from ABC1s. Partly because they were the least likely to vote UKIP last time (only 7% voted UKIP in 2015), but they also had the highest joint Lib Dem and Green votes in 2015 that Labour seemed able to draw upon.
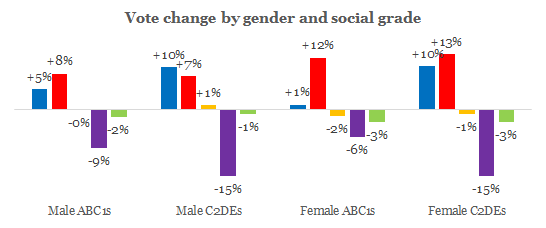 In the event, Labour shot up 12% amongst†female ABC1s, while the Tories saw almost no net movement at all.†On the opposite end of the scale, the Conservatives now have the largest†lead in votes amongst C2DE men (47% Conservatives vs. 39% Labour).
Social†segments
Splitting out†the UK population into a bit more detail,†we found†many of the patterns we’ve seen above played out in a slightly different way.
As expected,†the Tories have a large lead amongst retired voters while younger workers are more likely to vote Labour.†But, it’s interesting to see how†traditional class-based voting patterns have inverted amongst the young.
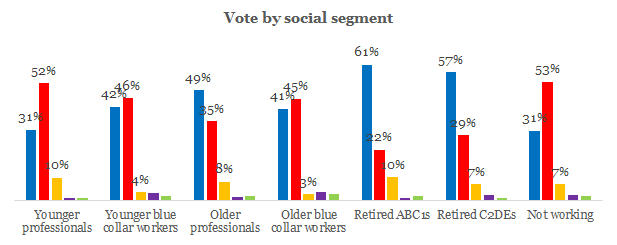 Amongst older workers and the retired the Tories received a higher vote share†from ABC1s than C2DEs. Even if the differences aren’t as stark as you’d traditionally expect, the old fault-lines of politics still faintly exist.
But the†most extraordinary†voting patterns can be seen amongst younger workers. One of the most pro-Labour groups in the whole population are young ABC1s. Jeremy Corbyn’s success was built†amongst the university graduates of the noughties and 2010s. And it looks like this pattern isn’t likely to end anytime soon – 70% of current students that voted†in this election†put†their cross in the box next to the Labour candidate, and they are the young professionals of the future.
Opinium’s on-the-day poll was conducted amongst 5,468†UK adults on†8th June 2017.