

Vibe Check: Time

One in six Londoners can’t read Big Ben
Gen Z adults are twice as likely to feel uncomfortable reading analogue clocks than the UK average
When thinking about confidence in reading different clock faces, UK adults report the highest confidence with a 12-hour digital clock (95%), followed closely by the 24-hour clock (94%). Confidence is lowest for analogue clocks, although this remains high overall at 92%.
Despite this high overall confidence in reading analogue clocks, there are clear generational differences. Only 81% of Gen Z say they are confident in their ability to read analogue time, with fewer than half (45%) saying they are very confident. This is significantly lower than among older generations, where at least nine in ten report they are comfortable (Millennial 90%, Gen X 97%, Boomer 99%). In fact, Gen Z are more than twice as likely as the UK average to say they are not confident reading analogue clock faces (19% vs 8%).
This may help explain why only one in ten (11%) Gen Z prefer to tell the time using an analogue clock face — significantly lower than the UK adult average (21%). Overall, a digital 24-hour clock is the preferred way of telling the time (47%), followed by an analogue clock (21%) and a digital 12-hour clock (18%).
One in six Londoners can’t read Big Ben
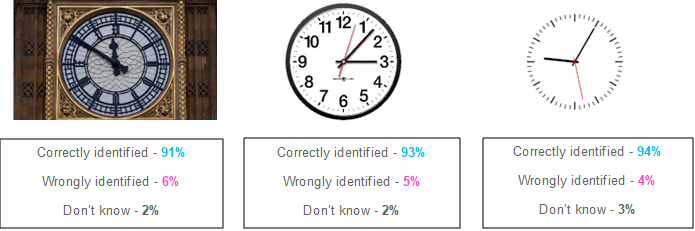
When put to the test, nine in ten (91%) adults correctly told the time shown in a picture of Big Ben. Gen Z did not fare as well, however, with only 77% correctly identifying the time, significantly lower than the next closest generation (Millennials, 92%). Londoners were the region least likely to be able to read Big Ben, just 84% could, meaning one in six are unable to do so.
Interestingly, other clocks fared a little better, with 93% being able to read clock two and 94% clock three. This is also true for both Gen Z and Londoners, of whom 87% and 86% respectively could read clock two, and 84% and 85% could read clock three.
Notably, UK adults who prefer to use an analogue clock are not necessarily best at reading one. Just 92% were able to read the face of Big Ben, 91% clock two and 95% clock three.
Smartwatches have overtaken analogue
Considering how they access the time, seven in ten (70%) UK adults have their phone set to a 24-hour clock — a much higher proportion than those using a 12-hour clock (17%) or an analogue clock (6%). While all generations prefer a 24-hour clock face, Gen Z are more likely than older generations to use a 12-hour clock (28%).
Meanwhile, two-thirds (66%) of adults currently wear a wristwatch, with ownership highest among Millennials (68%) and Baby Boomers (70%). Among watch wearers, smartwatches are the most common type (27%), closely followed by analogue watches (26%). Smartwatch use decreases with age, while analogue watch use increases. Just over one in ten (12%) wear a digital watch.
Quarter to the hour dropping in favour of X:45
When reading 3:45 pm out loud, the majority of adults would say “quarter to four”, while over a third (35%) would say “three forty-five”, and fewer than one in ten (8%) would say “fifteen forty-five”. Though this could be set to change, “quarter to four” decreases in popularity with age from 58% of Gen X and Boomers to 46% of Gen Z. While this is still Gen Z’s preferred way, 39% would say “three forty-five” highlighting a potential shift in language in generations to come.
Two-fifths of UK adults put their wristwatches forward on the day – but only one in four change their car’s clock in the same time
Ahead of the clocks going forward one hour on Sunday 29 March, UK adults are most likely to change their analogue clocks or wristwatches on the day the time changes (44% and 45% respectively). One in four are more prepared, changing both their analogue clocks and wristwatches the night before (each 23%). Interestingly, around one in twenty (4%) say they do not change the time on their device at all.
Meanwhile, at least one in ten adults do not change the clock on their oven (15%) or their car (10%). Among those who do change the clock one their oven, most do so on the day the time changes (33%), while one in ten (12%) change it the night before. However, updating the car’s clock often takes longer: only a quarter (25%) change it on the day itself, and just 6% the night before. In fact, one in five (19%) typically changes their car clock within two to three days.