


US: The great early & mail-in voting experiment
As part of the Opinium and Guardian US final national US poll of this electoral cycle, we surveyed 2,009 US adults between October 26th and 29th. With all the changes to voting procedure this year to take precautions around the pandemic causing widespread anxiety, we were interested in exploring how this massive experiment in ramping up early and mail-in voting has been going for Americans thus far.
Mail-in voting
As of this poll, only a third of potential voters plan to vote in person on election day (34%), with the largest chunk of potential voters choosing to vote by mail (39%) and nearly a quarter (23%) choosing to vote early in person. While voting by mail has trended upwards in each presidential election, from 7.8% in 1996 to 20.9% in 2016, this would represent an almost doubling of the percentage of votes cast by mail in just one election cycle.
Half of Americans (47%) are worried about mail-in voting being used to commit fraud.
This concern, regularly fuelled by President Trump, remains higher among those who self-identify as Republican-leaning (68%), but a sizeable 40% of Democratic-leaning Americans are also worried about this. Back in August, our polling revealed that 54% of Americans were also worried the post office would not be able to deliver ballots for mail-in voting in time.
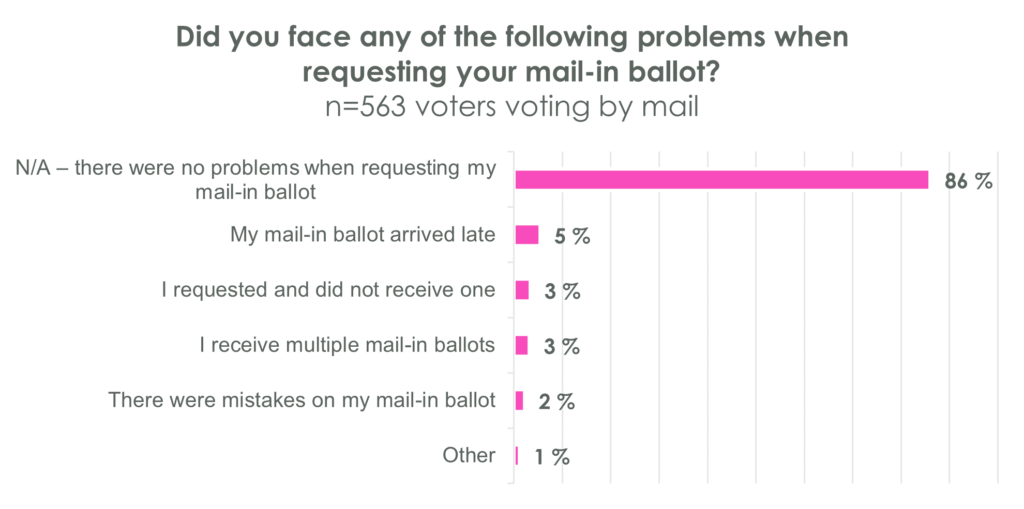
86% of those voting by mail have had no issues with requesting or receiving their ballot in the mail.
However, thus far, the mechanics of mail-in voting seem to have gone relatively smoothly with 86% of those voting by mail reporting they had no issues with requesting or receiving their ballot. Naturally, this leave 14% who have experienced an issue, likely affecting millions of voters. The most common mail-in voting issue was receiving the ballot late, experienced by 5%. 3% of those who requested a ballot in the mail did not receive one and an additional 3% received multiple. Interestingly, voters who identify as leaning Republican were more likely to report issues with their mail-in ballots—While 91% of Democratic-leaning voters say they had no issues with their mail-in ballot, this number drops to 81% among Republican-leaning voters, suggesting the politicization of mail-in voting is influencing reporting here.
In-person early voting waiting times
On average, Americans have had to travel 14 mins to their polling stations and have waited 20 mins in line during early voting.
On average Americans who have already voted early in person have only had to travel for an average of 13.9 minutes to get to their polling stations, with almost half (48%) saying it took them under 10 minutes to reach their polling station and a little over a third (36%) saying it took them 10-20 mins. This drops to 11.6 mins for urban voters, while it is slightly higher (predictably) for suburban and rural voters (14.6 and 14.1 mins respectively).
Despite some states, like New York and California, reporting long lines for early in-person voting, early voters nationwide have had to wait 19.7 minutes in line on average to cast their ballots. Over a third of voters report not having to wait at all (36%) and an additional quarter report waiting less than 15 mins in line (24%). Fewer than 1 in 10 early voters (9%) have had to wait more than an hour to cast their vote.
National poll – full data tables here;
To be notified of upcoming US research when it goes live, sign up here.